





Read the wishlist dashboard
Simple WishlistsUpdated
The dashboard at Wishlists › Dashboard shows what your customers are saving and what they want most. It has your store totals, a 30-day chart of wishlist activity, your most wishlisted products and suggestions for products to restock or discount. Figures are refreshed every few minutes.
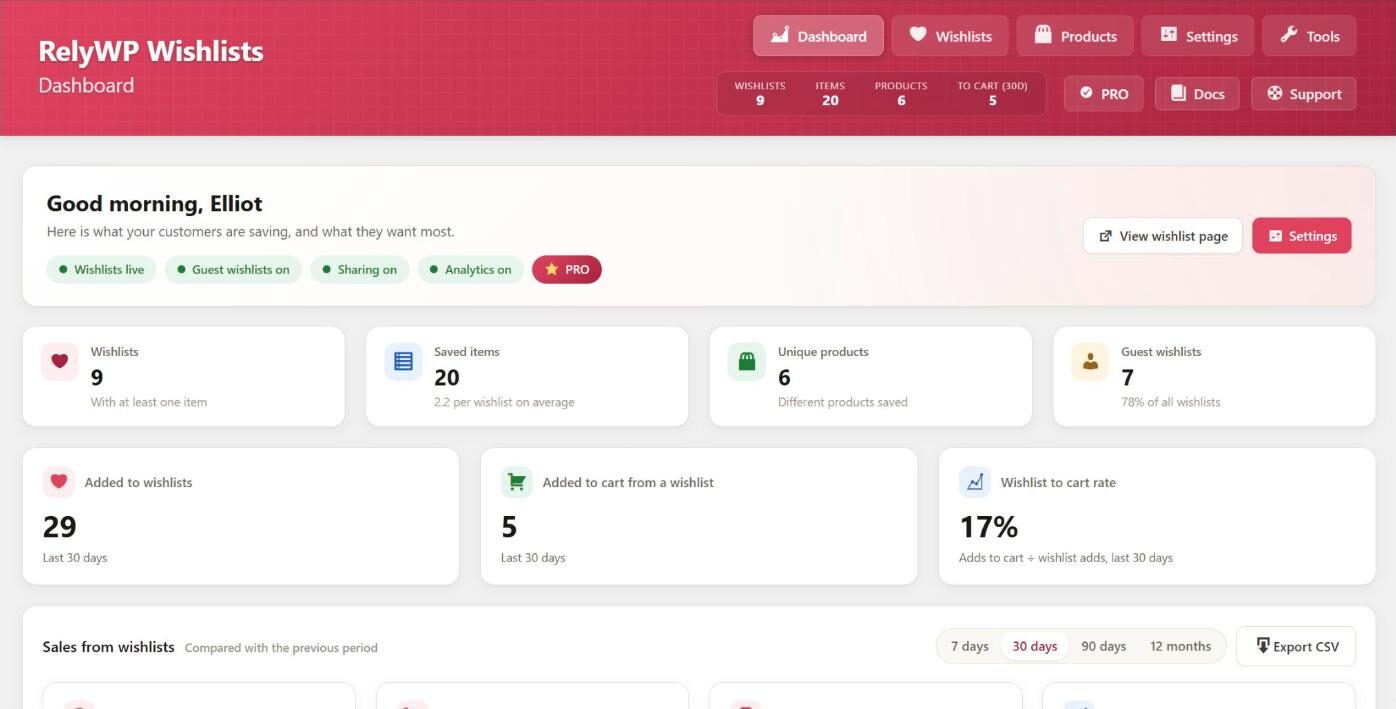
The header
The header shows whether wishlists are live, whether guests can save, and whether sharing and analytics are on. Use View wishlist page to open the page customers see, and Settings to change anything.
Until setup is complete, a Finish setting up your wishlists checklist is shown: choose a wishlist page, show the wishlist button, save your first product and review your settings. You can open the setup wizard from here or click Dismiss.
Store totals
- Wishlists: wishlists with at least one item.
- Saved items: items across every wishlist.
- Unique products: how many different products are saved.
- Guest wishlists: lists kept for logged-out shoppers.
- Added to wishlists and Added to cart from a wishlist: activity in the last 30 days.
- Wishlist to cart rate: adds to cart divided by wishlist adds over the last 30 days.
Wishlist activity chart
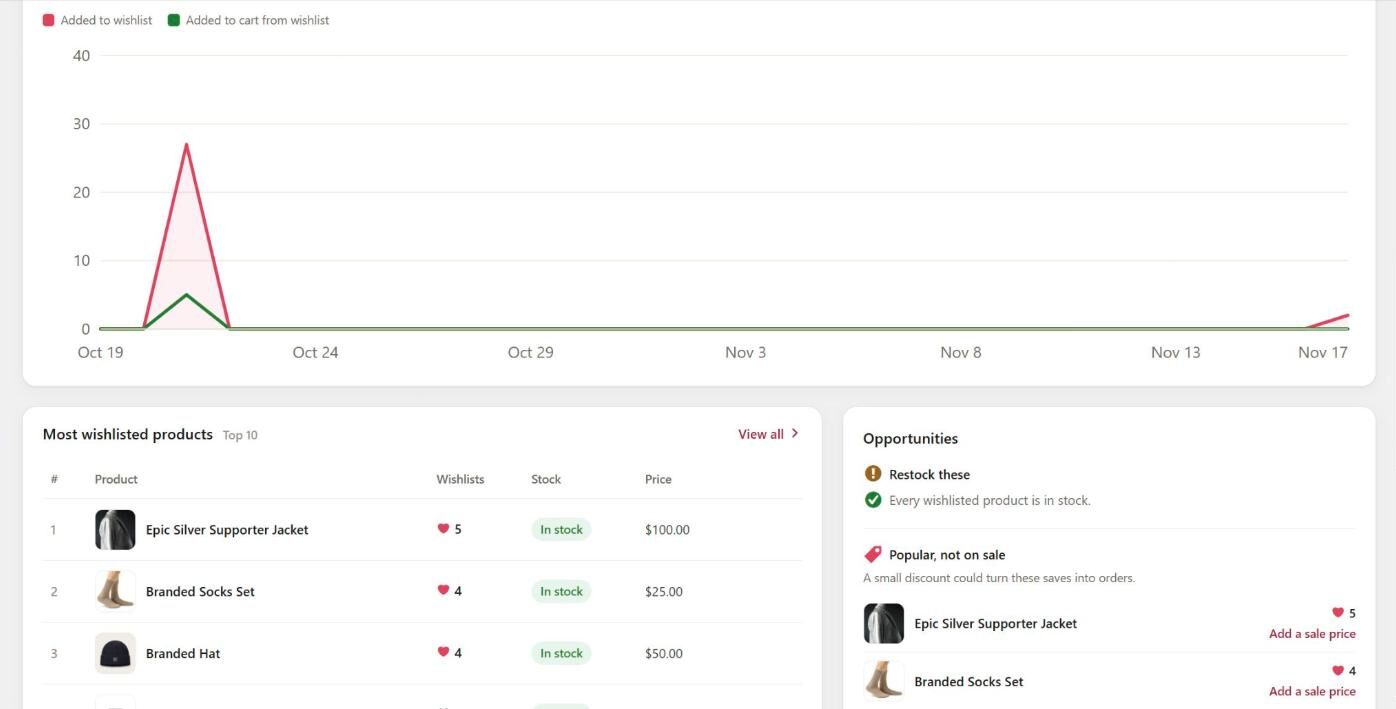
The Wishlist activity chart shows wishlist adds and adds to cart per day over the last 30 days. It needs analytics to be on (Wishlists › Settings › General › Record wishlist activity for reports). If analytics are off, the dashboard says so and no new activity is recorded.
Popular products and opportunities
- Popular products: your most wishlisted products with their stock and price. View all opens Wishlists › Products.
- Restock these: wishlisted products that are out of stock.
- Popular, not on sale: favourites where a small discount could turn saves into orders, with an Add a sale price link.
More reports in PRO
PRO adds date ranges, revenue from wishlists, a conversion funnel, top converting products and a CSV export to this dashboard. In the free plugin, this card shows example data.